GUI
AlloViz can be run with a Graphical User Interface (GUI) that uses VMD (Visual Molecular Dynamics) for the visualization of the networks and analyses on the protein structure. VMD must be installed.
Note
The json library for VMD must be installed as well. It is already included in the alpha version of VMD 1.9.4.
Alternatively, both stable VMD 1.9.3 and the json library can be installed in a conda environment: conda install -c conda-forge --solver libmamba vmd tcllib
sqlite 3.41 or higher might need to be installed in case of an sqlite3-related error when trying to launch the GUI.
To launch the GUI, run the following command on an environment with AlloViz and VMD installed:
vmd -e gui/run_vmd.tcl
This is how the GUI looks like:
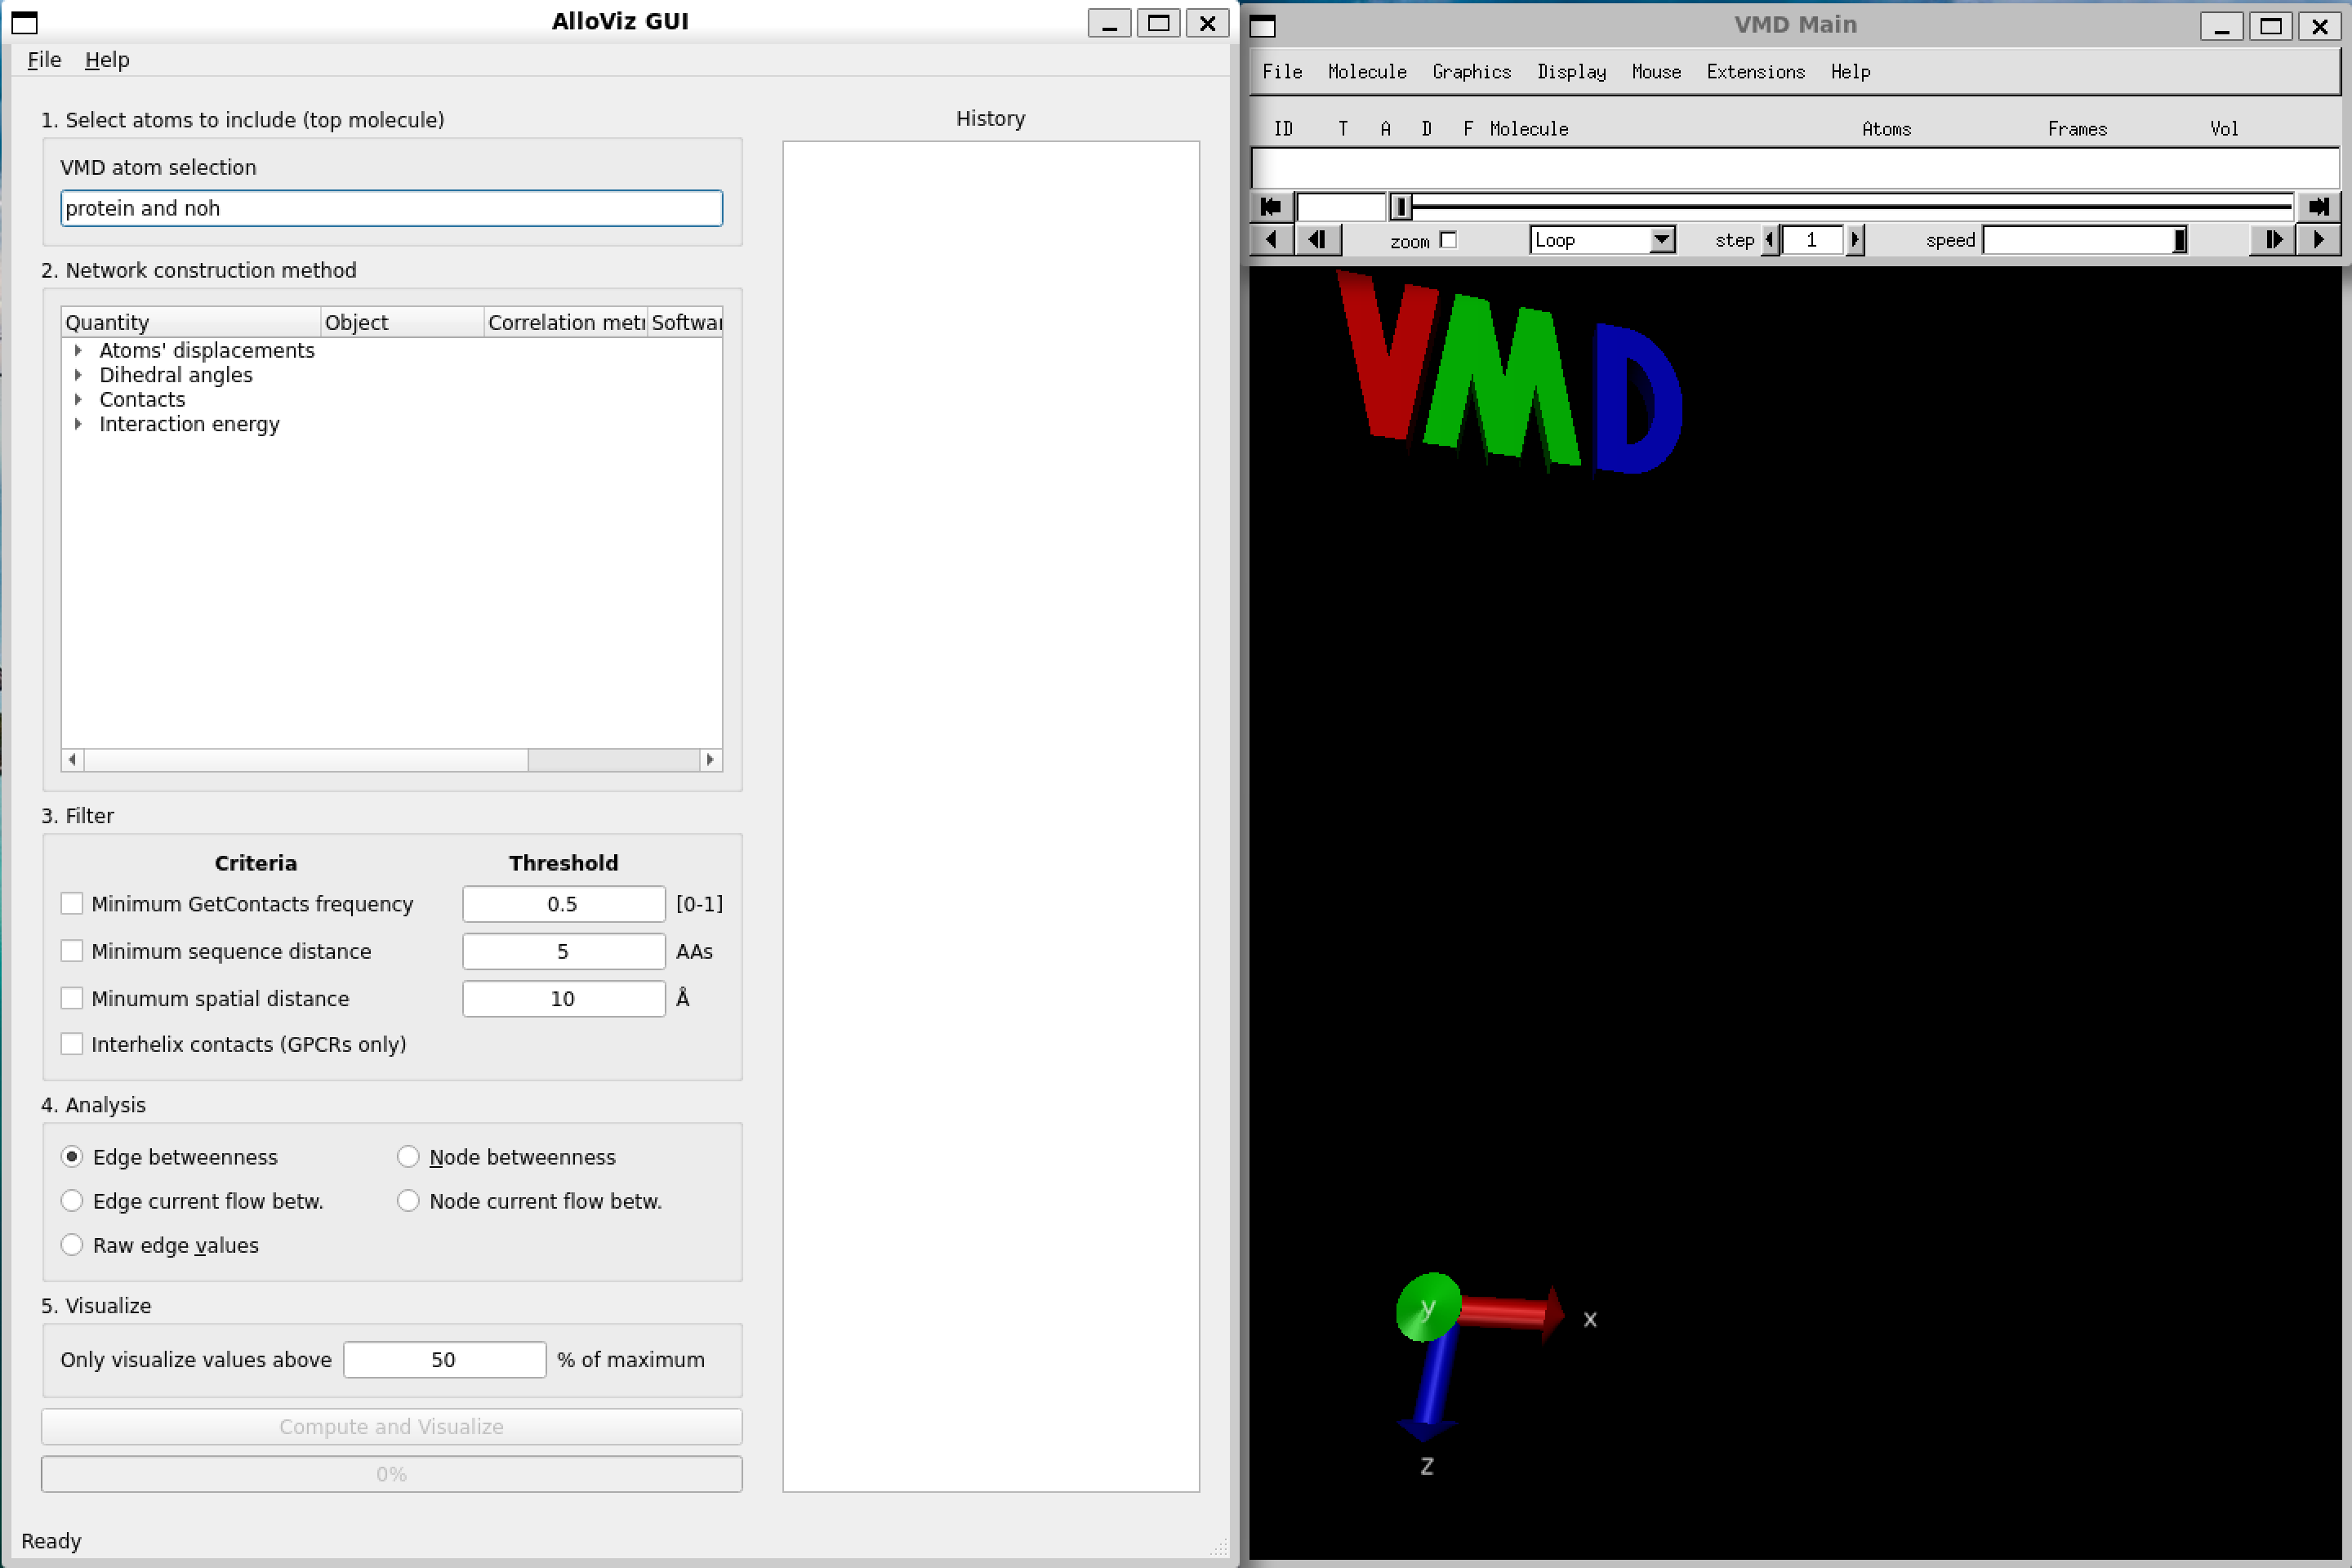
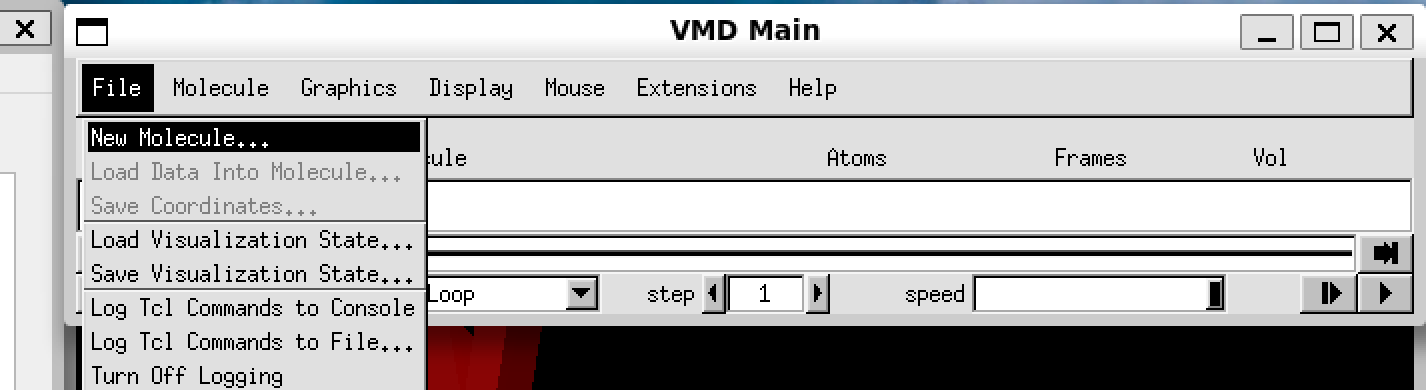
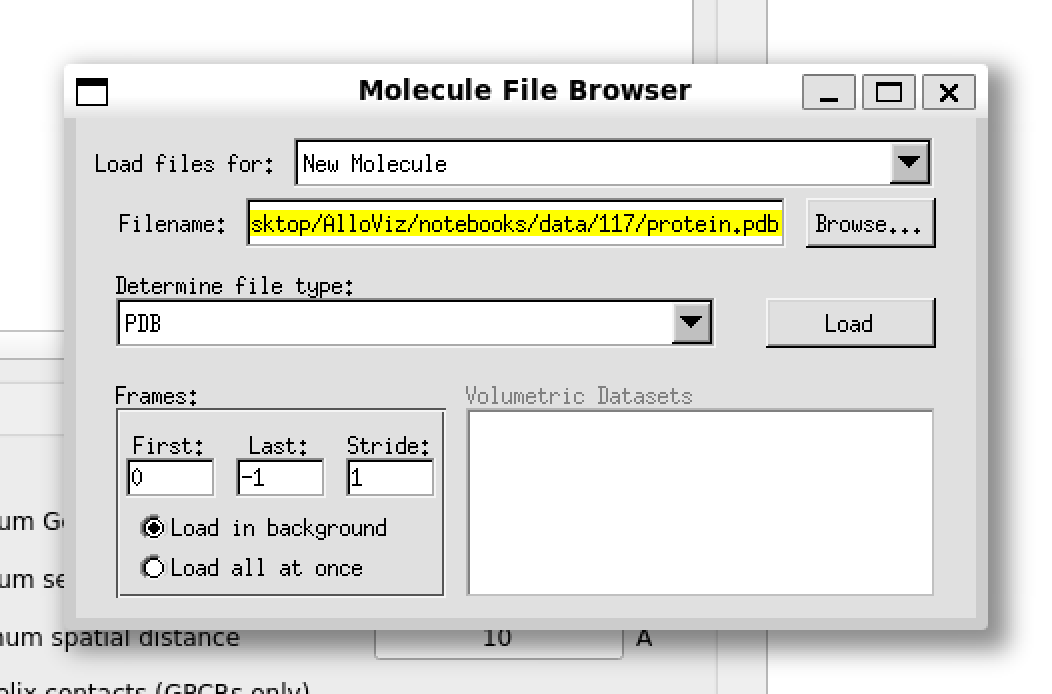
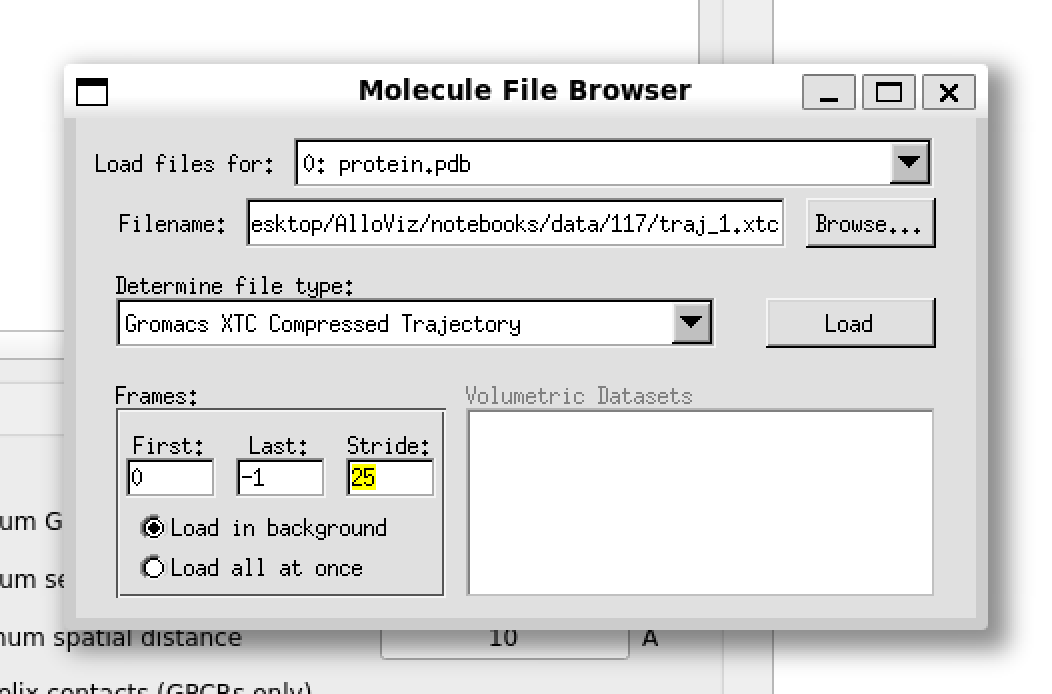
We can load one of the structures and trajectories that come with AlloViz’s tutorial notebooks into VMD as usual. They are located in AlloViz/notebooks/data/117 and they correspond to the GPCR Beta-2 adrenergic receptor in complex with agonist epinephrine (GPCRmd ID 117). We can use a stride of 25 frames for the trajectory to speed up the loading process.
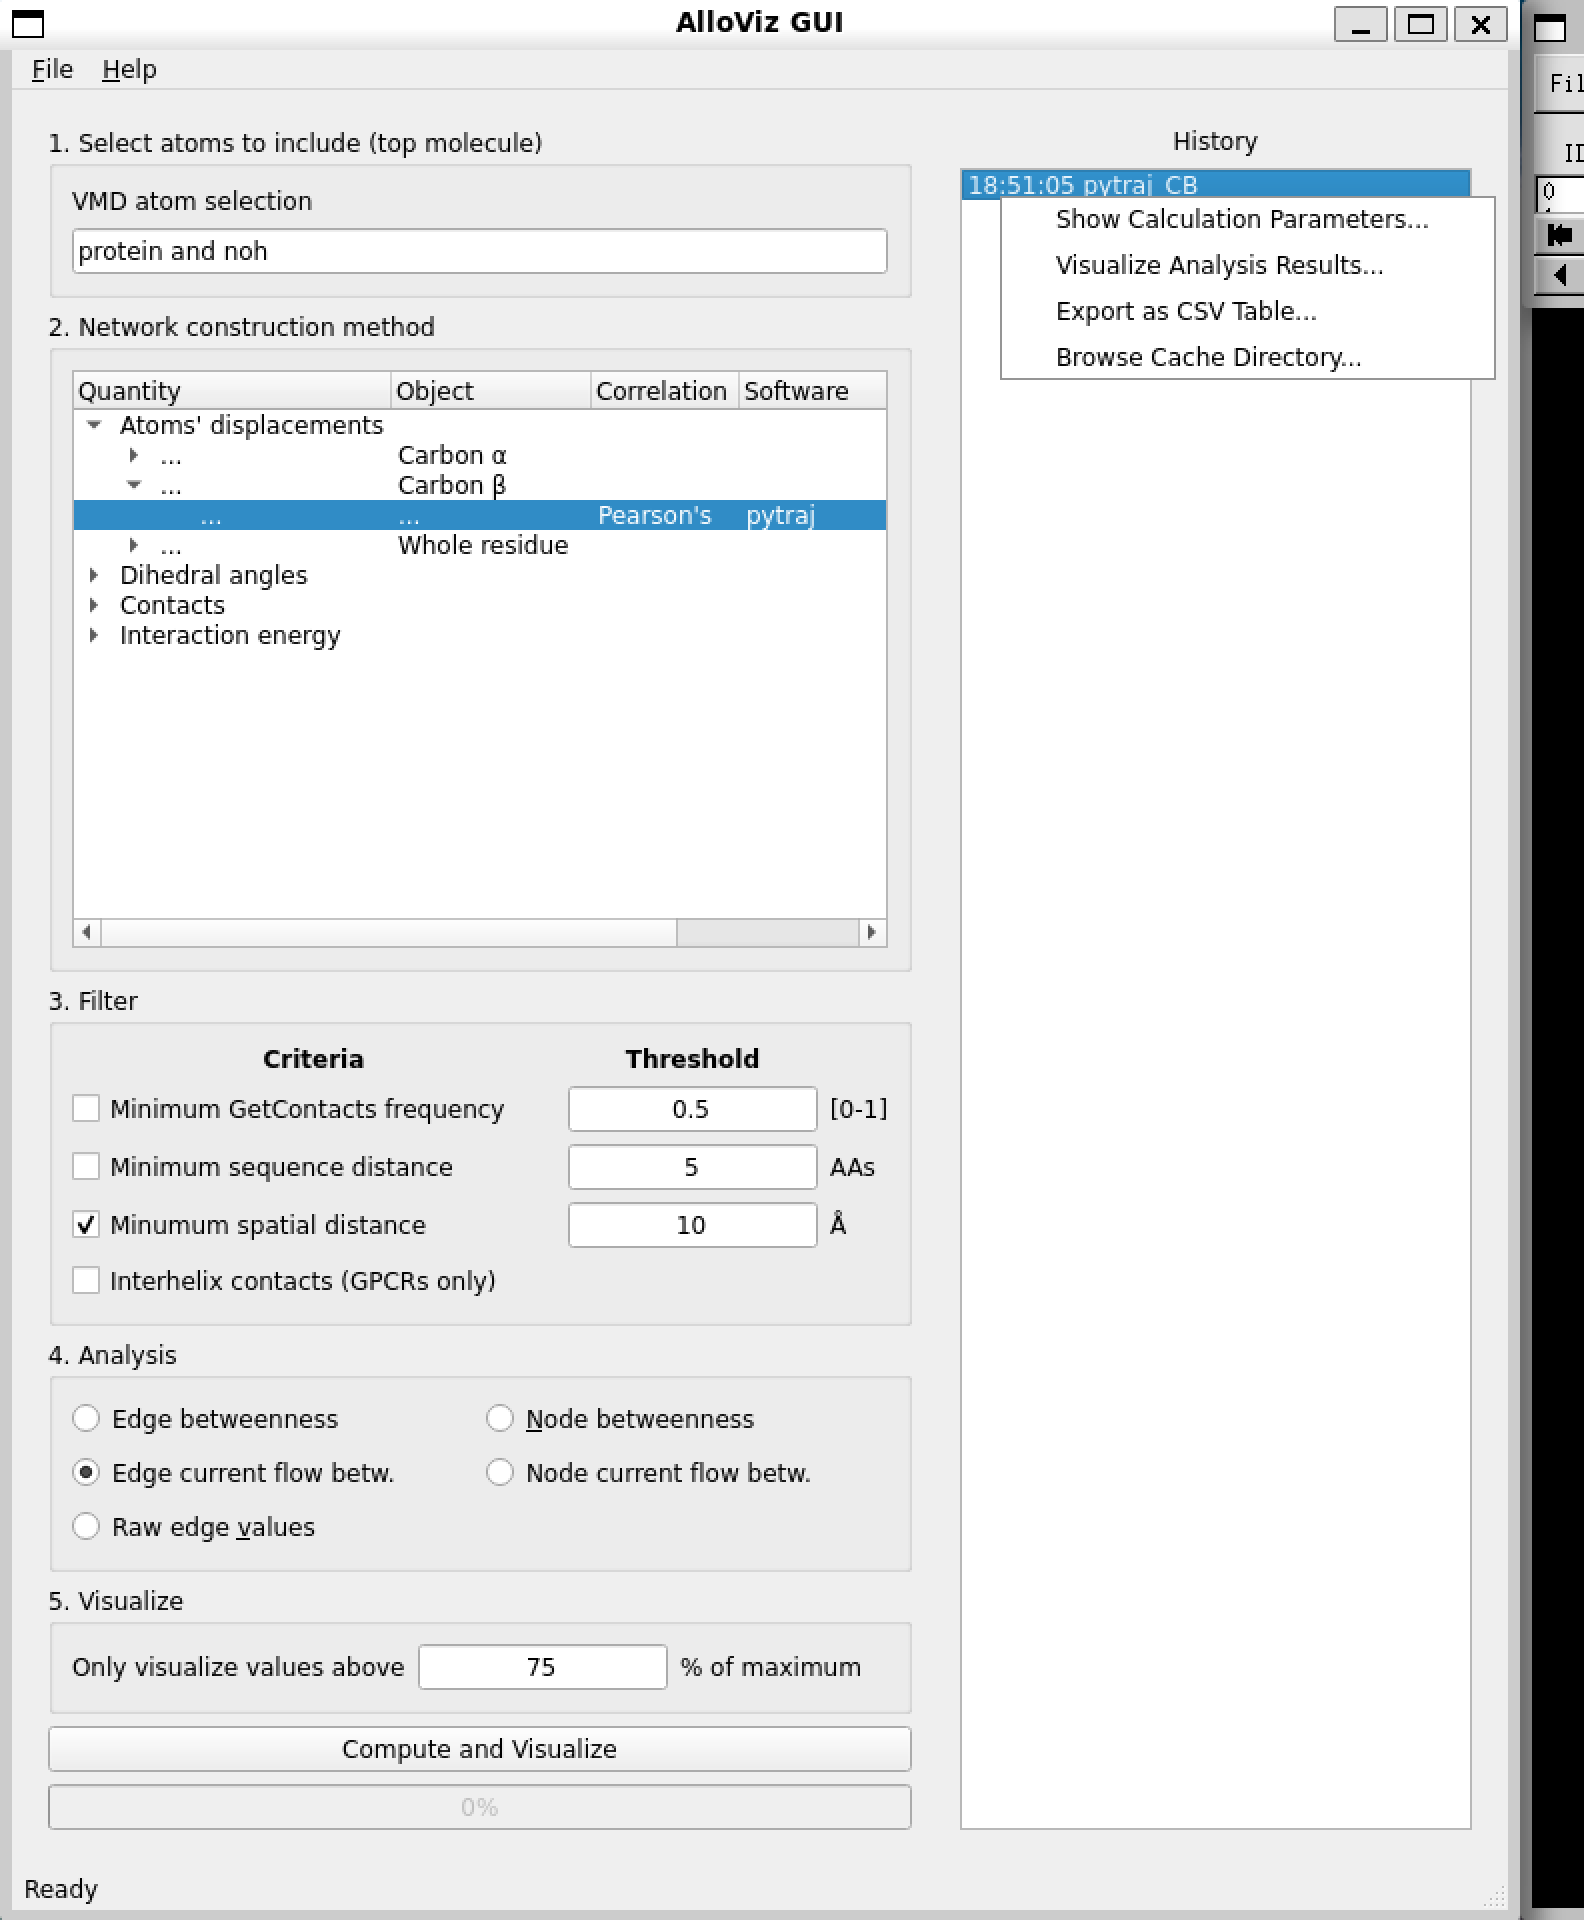
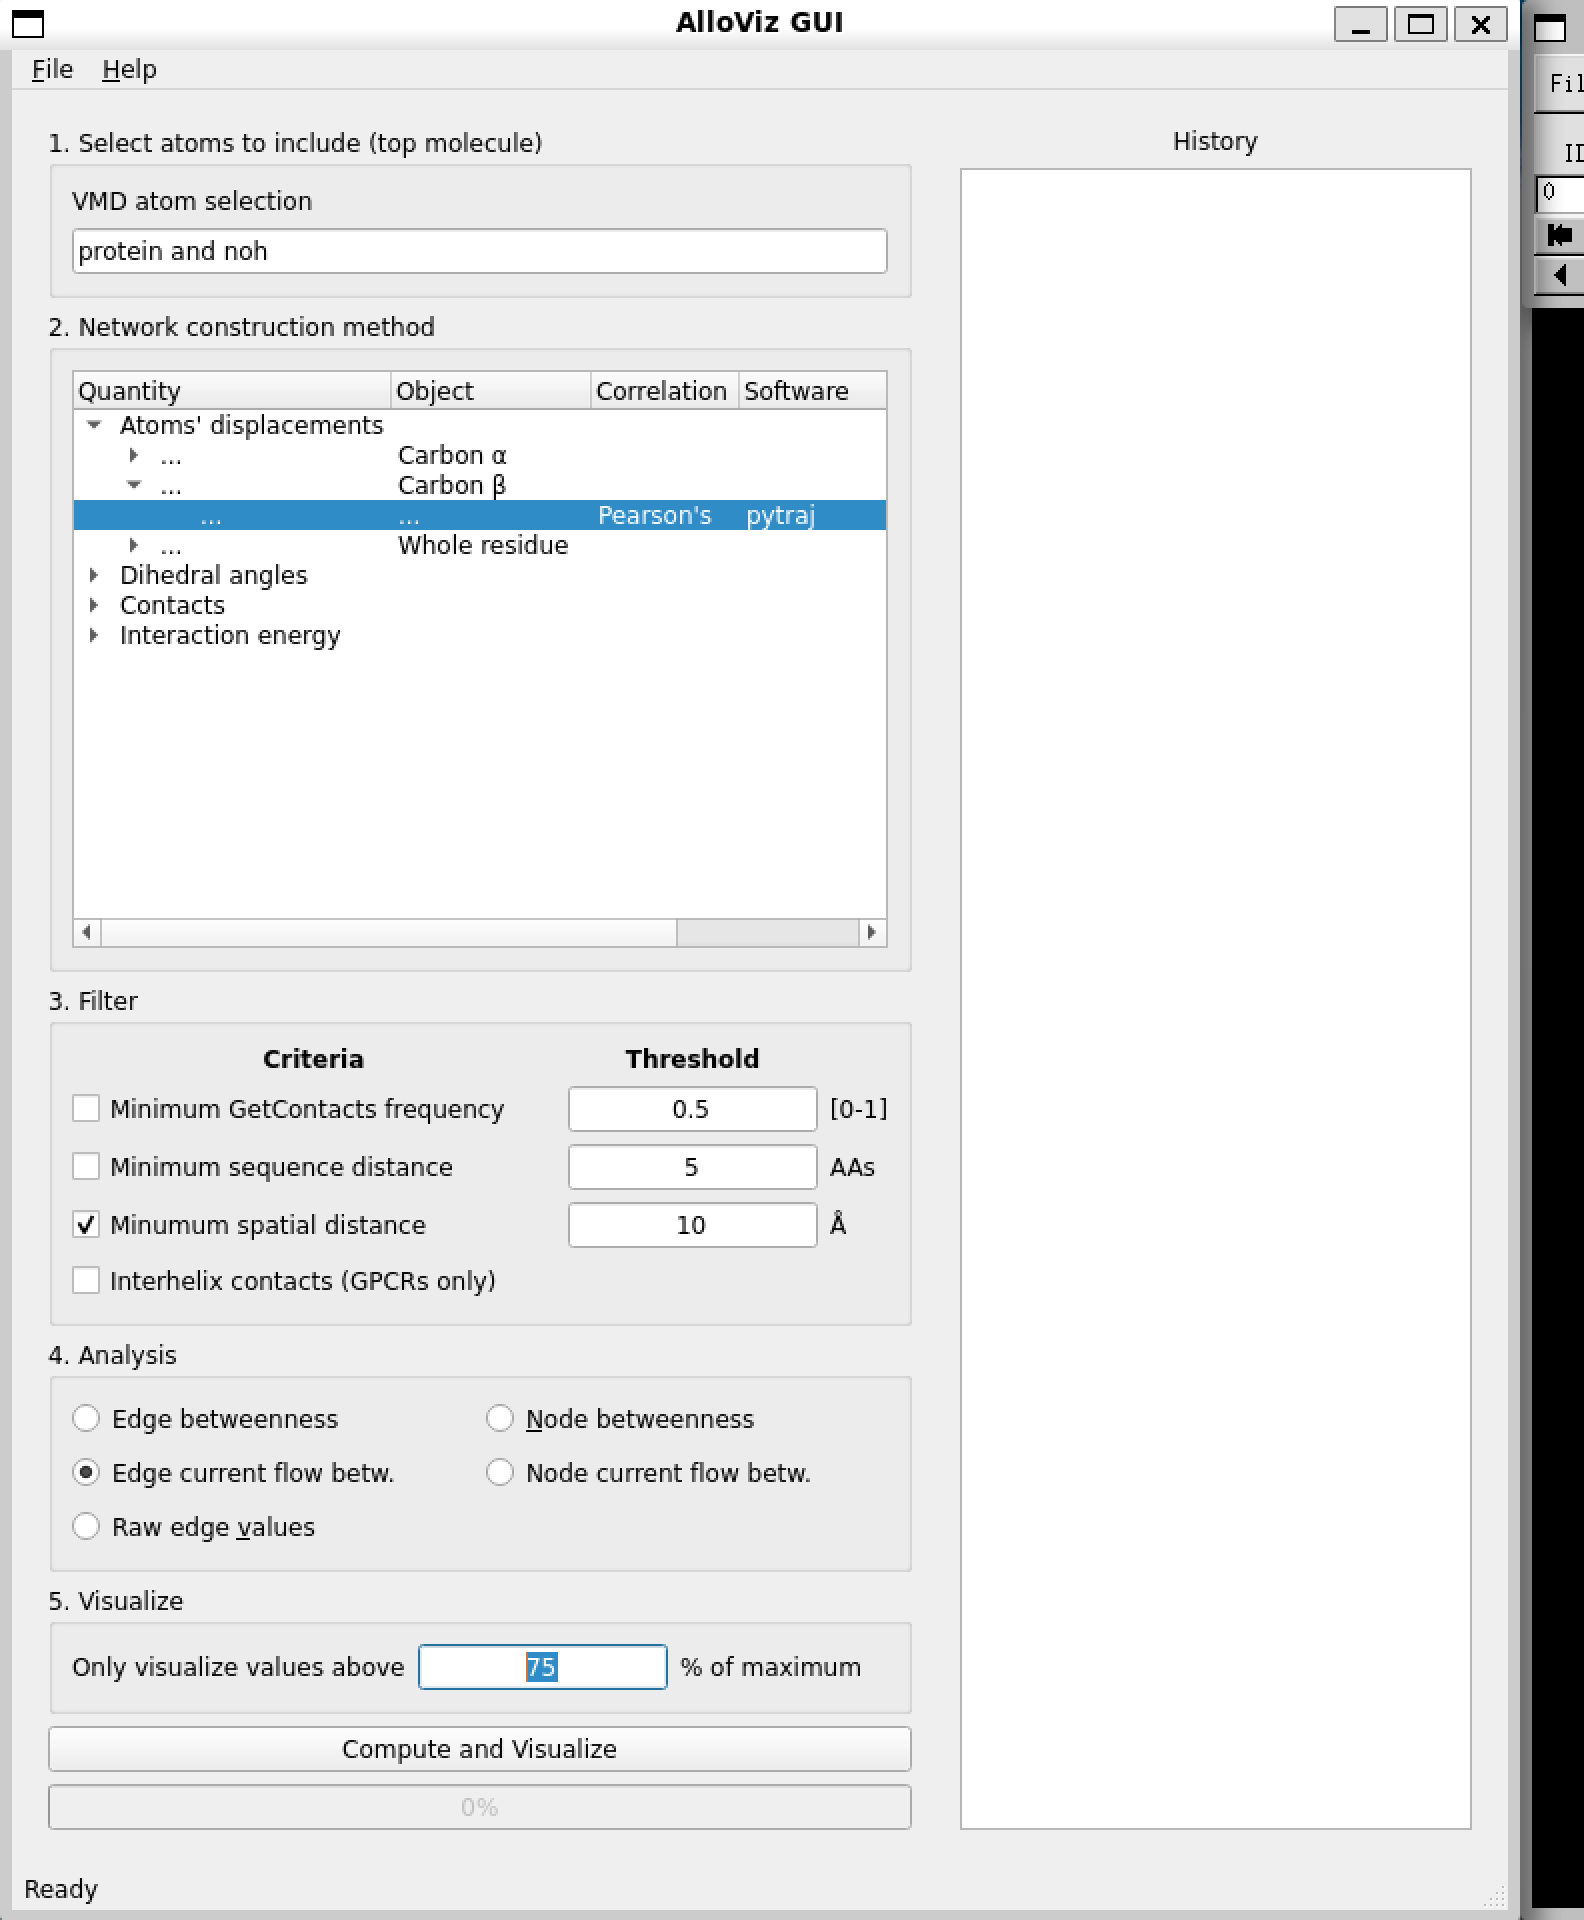
In the AlloViz GUI window we can choose the specific options we want to build, analyze and represent our network of choice:
The first step is to specify the atom selection to be taken into account for analysis. The trajectory provided with the notebooks is already processed and doesn’t contain waters, ions or a ligand so we simply use the default selection of the whole protein.
Then, we choose the type of network to compute out of all the options AlloViz offers. In this case, we choose to measure the Pearson’s correlation of the residues’ beta-carbons using the package pytraj.
We choose to filter the computed network by only keeping residue pairs that are further apart than 10 Ångstroms in the structure.
Finally, we pick to analyze the networks’ edges using the current-flow betweenness centrality metric.
And choose to represent on the structure in the VMD visualizer the top edges with a value above 75% of the maximum value.
After clicking “Compute and Visualize”, the selected options are represented on the protein structure on the VMD visualization window (we have changed the representation from the default to Cartoon):
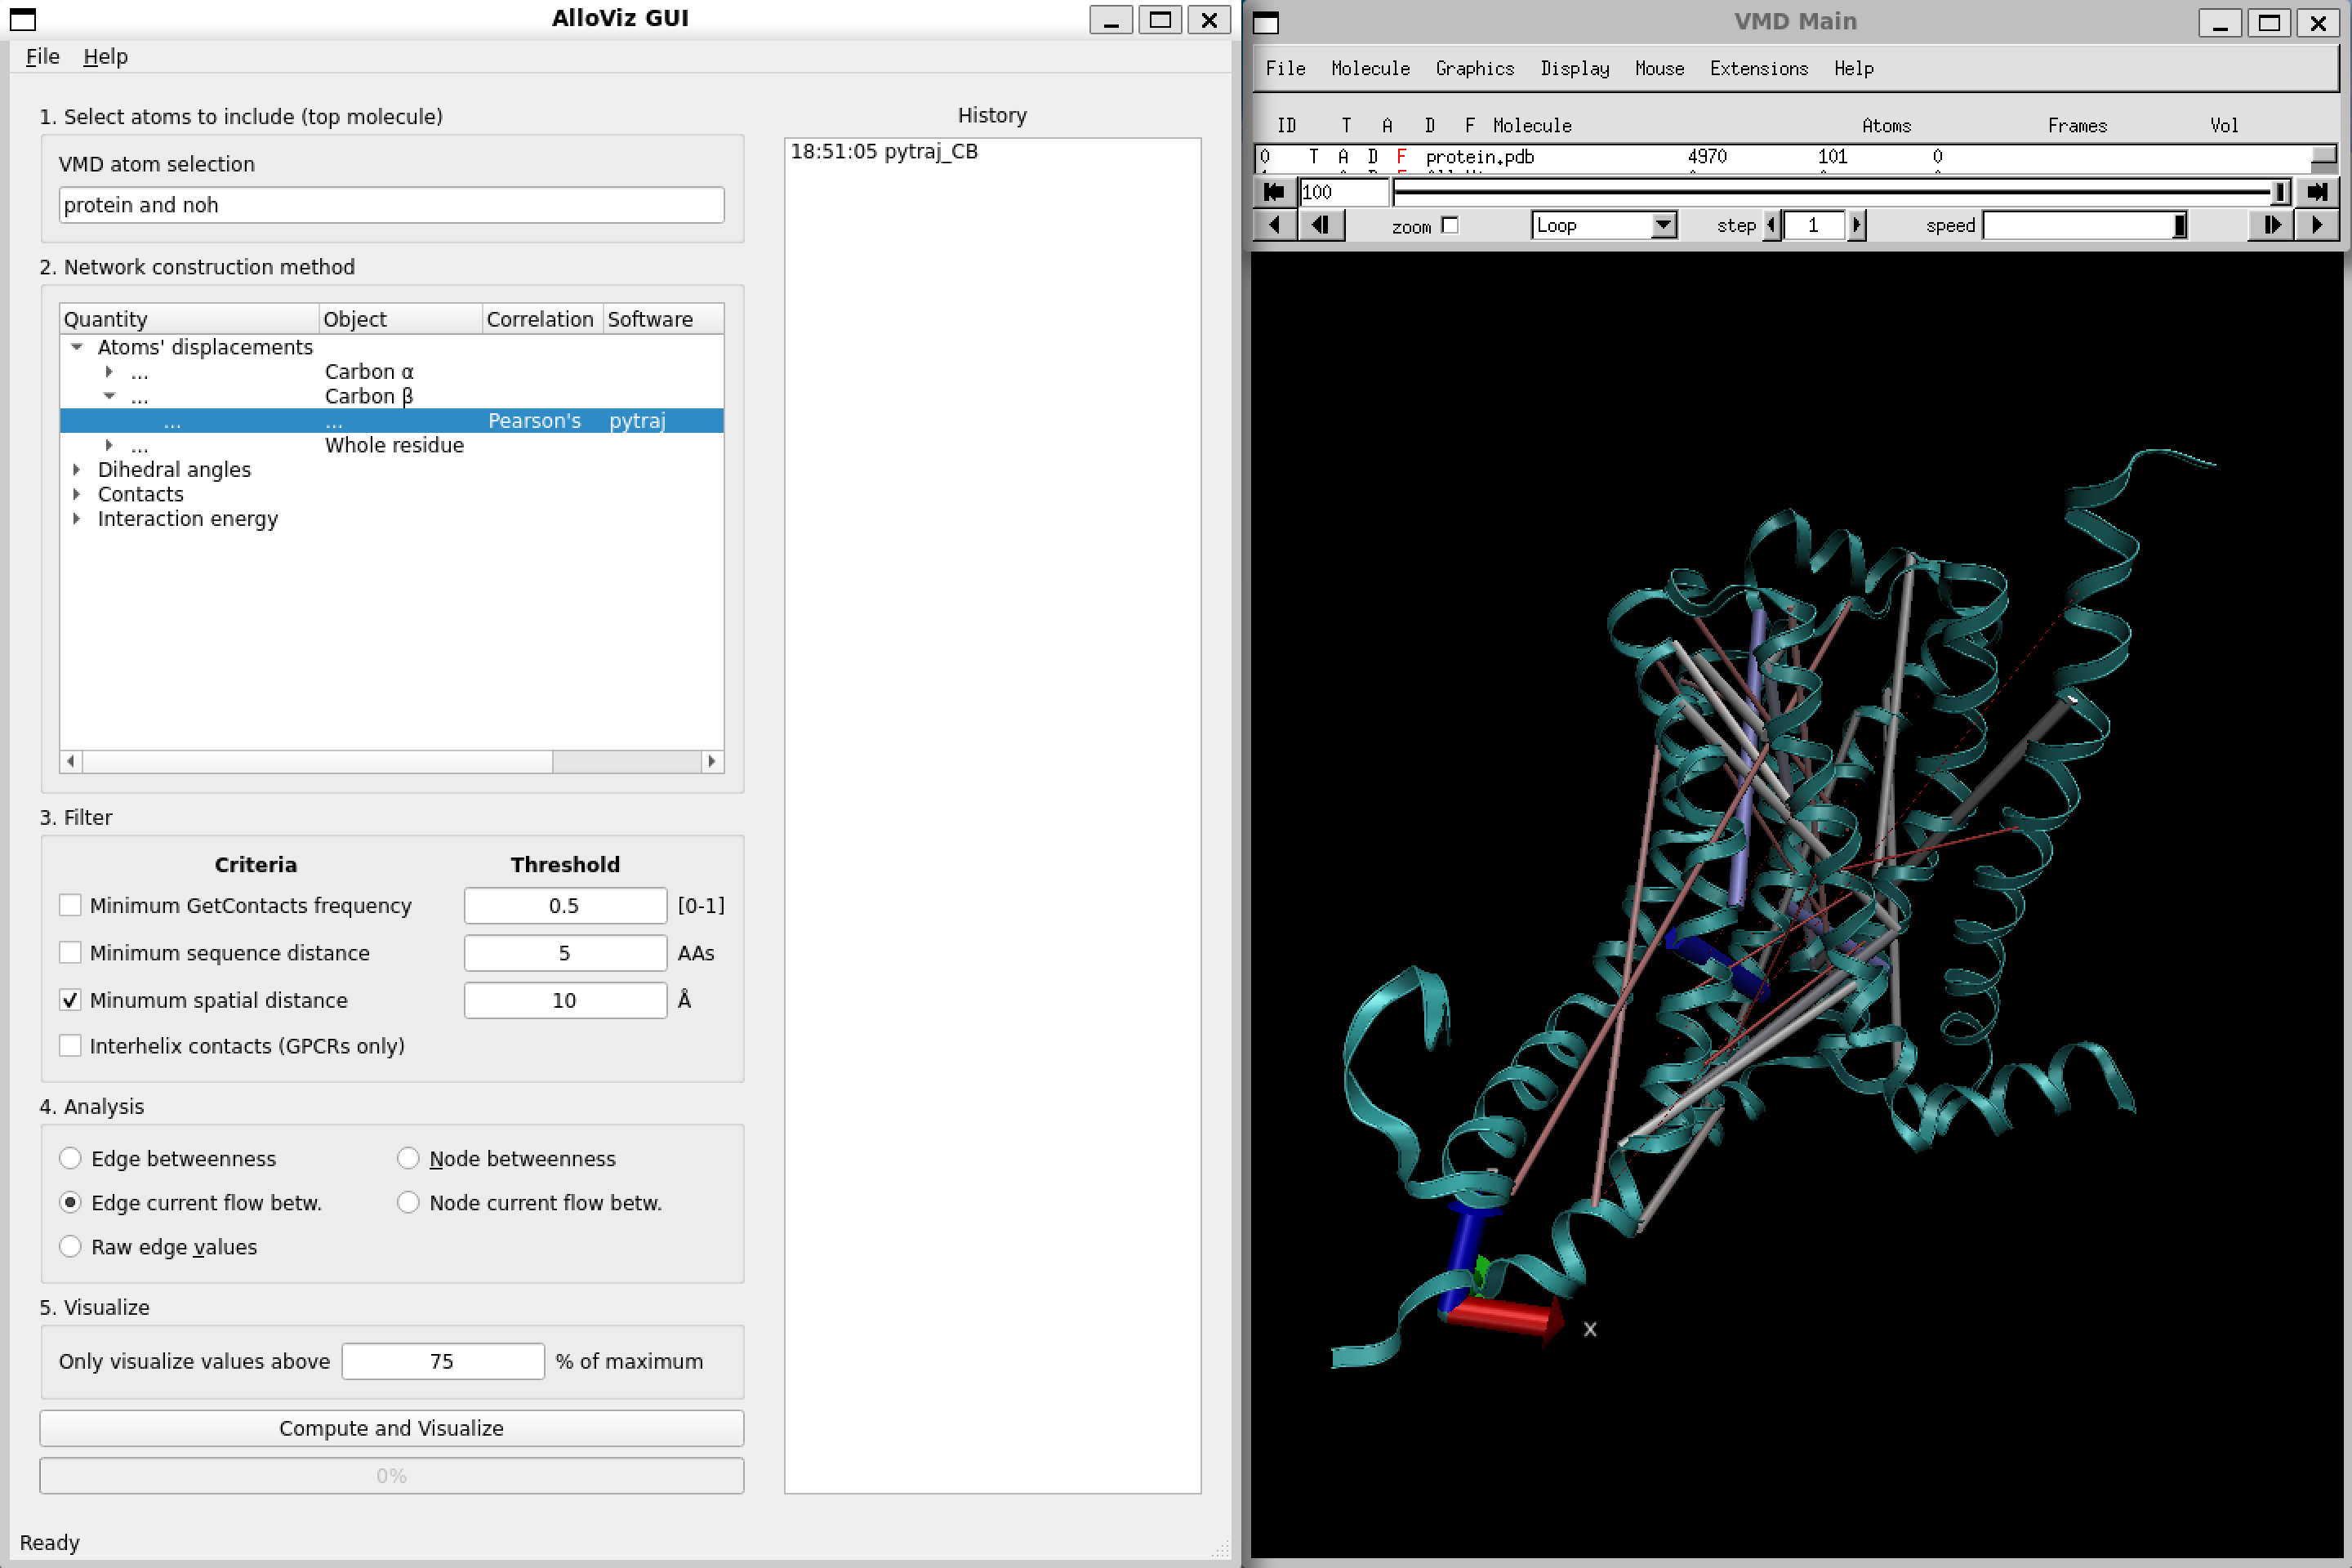
Moreover, the calculated network and all the following analyses we might perform are logged in the right panel of the AlloViz VMD window, and we can get back to a previous analysis or even save the data in .csv format by right-clicking on the analysis and selecting the desired option: